Numerous times in recent years I’ve had to use Reflector Pro to debug third-party dlls. While this works well and allows you to step through code as if it was your own the value of doing so can be completely lost if you cannot see critical object values due them being ‘optimized away’.
Recently I was stuck with a problem of optimization that refused to be disabled by the usual means that I’d used in the past. I stumbled onto a neat trick which finally did work, but it also clarified what happens when the web application, usually Sitecore CMS, restarts.
Is it even optimized?
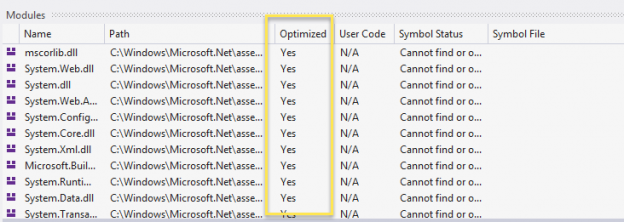
We’d better check, else we could be chasing rainbows. With the debugger attached, you can open the ‘modules’ window (Debug > Windows > Modules) and see the status of the dlls loaded. Sure enough this confirmed that the code being looked at was indeed still optimized despite using both of the standard fixes described here.
Disable Optimizations
The usual settings to turn off optimization are to either A) Launch Visual Studio with the environment variable ‘COMPLUS_ZapDisable=1‘ set, or B) Drop an .ini file alongside the dll in use. Both are described in great detail in relation to Sitecore on this JammyKam blog post so I won’t duplicate further here. In any case, the problem was that for some reason neither technique was working, and not for the first time. Hiding in the comments of that same post was a killer tip from Chris van de Steeg – first attach the debugger, and then save a change to web.config to invoke a restart. Sure enough, this works!
App restarts
Bumping web.config doesn’t recycle the application pool, instead is recycles the app domain within the existing application pool. Crucially keeps the same worker process, and debugger, attached.
The following will invoke an app domain restart:
- Modification to web.config or Global.asax
- Change to the contents of the application’s bin directory
- Change to the physical path of the virtual directory
- Deletion of the subdirectory
An app domain restart will reload modules and re-JIT optimize them but the presence of the attached debugger successfully prevents JIT optimizations from occurring. Now I can step through third-party code with Reflector Pro and with full visibility of locals and autos.
Kudos to Jammykam and Chris for sharing. It’s made using Reflector Pro for debugging something that I can rely upon again.